INFORMERS: Infographics Transform Data To Drive Business

What if you were able to transform your drab and unassuming data into something that your customers would want to review and be more intrigued to take a greater interest in your business? In the movie Transformers, the filmmakers create scenarios where normal cars are turned into alien robots and excitement ensues! And the same way that average cars are converted into something more interesting, Infographics allow you to transform your data to inform and generate excitement with your audience!
So what are infographics? They are visual representations of information or knowledge. Instead of simply listing data and facts, infographics allow your company or brand to showcase information in a graphic and more visually appealing format. Infographics are a type of content marketing, where the idea is that your company can be a thought leader by sharing interesting and helpful information. And if customers take the time to become informed with what your business has to share in this longer form of advertising, they will see you as an expert and reward you with their business and loyalty.
While this may seem like simply an artistic way to display information, companies have been using it to their advantage for some time now. Below are some benefits of how businesses have been using infographics to gain incredible results for their brands.
MAKES DATA INTERESTING
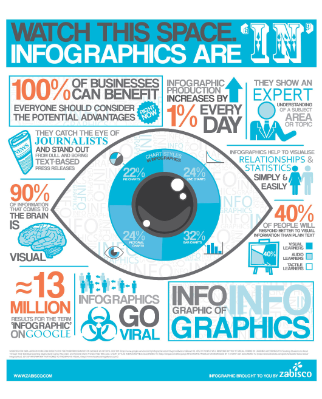
Human beings are highly visual. Most people forget a large portion of what they’ve read, but they do remember what they see. In fact, 90% of information that we remember is based on visual impact and a high quality infographic is 30 times more likely to be read than text-only articles. This is because infographics are more eye-catching than printed words through the use of combining images, colors and illustrations. They help your customers understand the facts that you have to share with them quickly and in a more memorable and compelling way.
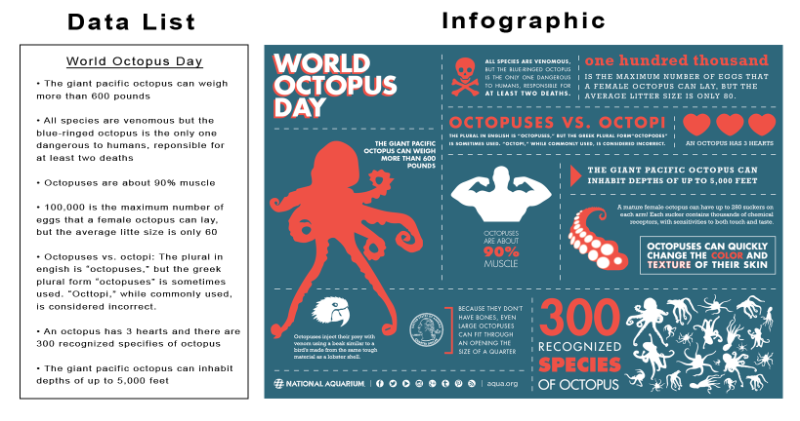
Take a look below at a comparison of a simple list of facts on the left side versus the more appealing information shown in an infographic format on the right side.
BOOSTS CREDIBILITY AND THOUGHT LEADERSHIP
Your content marketing strategy should always come before your social strategy, because you first need content, like infographics to share. When you share information on a regular basis, your customers begin to see you as an expert in your industry. Infographics are a great way to build brand awareness because 40% of people respond better to visual information than text. It allows you to gain trust with your audience and the more comfortable they feel with what you have to say, the more likely they will see your business as a credible thought leader. This creditability will eventually turn these prospects into customers.
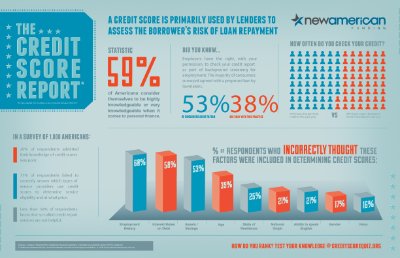
New American Funding provides facts on how to determine your credit score through this infographic example. If you are their target and find this information valuable, you will likely be interested in learning more about this company.
DRIVES TRAFFIC TO SITE
A high quality infographic gives bloggers something valuable to share on their site that their readers can enjoy. And they will want to include your infographic if it supports their blog content and is of value to their reader. The benefit for them is that their readership remains high and the value for your company is that when one of their readers clicks on the infographic, it will drive new traffic to your site. Businesses that use infographics grow in traffic an average of 12% more than those who do not. And be sure to always include an embed code so it is easy for people to share on their blog or via social media, such as Pinterest. This increases the chances of this infographic becoming viral. It is also a good practice to track the Infographic’s URL by creating a tag in URL Builder so that you can later see its impact in Google Analytics.
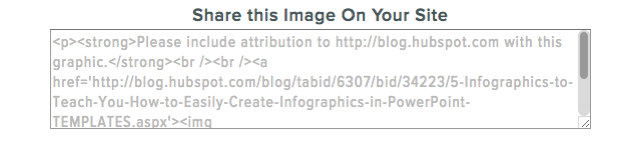
Here is an example of what an embed code looks like at the bottom of your infographic:
IMPROVES YOUR SEO EFFORTS
A big part of improving your visibility through SEO is by the number of inbound links that point to your website. This is because Google and other Search Engines view inbound links as a recommendation. Since infographics contain a link back to your site and display information that people can quickly understand, a good infographic will result in a lot of inbound links. And the more times it is shared and embedded, the more SEO value and visibility you will have coming to your site. If that is not enough to persuade you, building links this way is half the cost of a standard online marketing campaign.
From the above points you can see how valuable an infographic can be for your marketing. The first step is to put together a strategic plan of what the objective is, determine what the value will be to your audience, and how you are going to promote it. Then work with a designer to make it eye-catching and interesting. If it is not a high quality, people will not want to embed it or share it, and that will not be of value to your company. You can also negotiate a paid agreement with bloggers to contain it on their site for a certain amount of time. Some companies are even creating interactive infographics that allow users to interact with the data and showcase movement which enhances the experience.
If you do it right, Infographics will transform your data to inform and attract your audience. Through the use of illustrations, images and data, your company will improve its brand awareness, credibility, traffic, and visibility. And unlike in the movie Transformers, this can all be done without having to change into an alien robot!
What do you think? What are some other benefits of using Infographics?
If you enjoyed this post, I encourage you to write a comment, like it, or share it with your network. You can also select one of these hyperlinks to follow me on LinkedIn, Instagram, Twitter, Facebook, or Pinterest.
Want to learn more about Infographics? Check out the following resources, where I obtained some of the above information: Infographic Effectiveness Statistics,How Infographics Help SEO, 9 Awesome Reasons To Use Infographics In Your Content Marketing, 6 Benefits of Using Infographics, Use Infographics To Boost Your Credibility And Traffic, Why Your Business Should Be Using Infographics,Top Benefits of Using Infographics As A Powerful Marketing Tool, 10 Reasons Why Infographics Still Matter In SEO, How To Make Infographics And Get New Business, Visual.ly’s Create Interactive Infographics, & Using Infographics To Draw Customers To Your Website.
Leave a Comment